Adventure tourism market projections and what they mean for small operators
The adventure tourism market is heading toward $1 trillion by 2030. You’ve probably seen that number bouncing around industry newsletters and conference slides. What nobody seems to explain is what a projection like that actually means when you run a six-boat rafting operation or guide fly fishing trips out of your truck.
Here’s what it means: more people want what you sell. The question is whether they’ll find you or book through someone else.
This article breaks down the major market projections, strips out the investor jargon, and translates each trend into something you can act on this year.
The market numbers, without the spin
Allied Market Research pegs the global adventure tourism market at roughly $896 billion in 2025, growing to an estimated $1.93 trillion by 2034. Grand View Research projects the market hitting $1 trillion by 2030, with a compound annual growth rate around 16.8%. The Adventure Travel Trade Association values the global adventure-oriented outbound market at $1.16 trillion, with North America accounting for $188 billion of that.
These numbers vary wildly depending on who’s counting and what they include. Some reports fold in airfare and accommodations. Others focus on activity spend alone. The exact figure matters less than the direction: the market is growing at 8-17% annually depending on the source, and it’s been doing that consistently since 2021.
For a small operator, the relevant stat is this one from the ATTA: 76% of adventure trip spending stays within the local economy. That $188 billion North American market isn’t flowing to corporate headquarters. It’s flowing to guides, outfitters, lodges, and the restaurants where your clients eat after a day on the water.
Soft adventure is eating the market
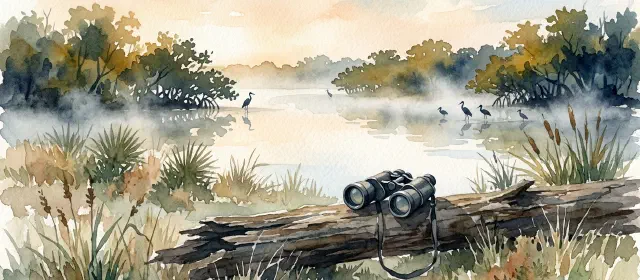
The soft adventure segment commands roughly 61-65% of the total adventure tourism market. Soft adventure means hiking, kayaking, snorkeling, wildlife watching, cultural tours. Not BASE jumping or ice climbing.
This matters because soft adventure is exactly what most small operators sell. A guided half-day kayak trip on the Boundary Waters. A wildlife safari through Yellowstone. A fly fishing float on the Missouri River. You’re already positioned in the fastest-growing segment without having to change anything about your business.
The median adventure trip costs $3,000 per person, excluding airfare. That’s $341 per day across an average 12-day trip. If you’re a day-trip operator charging $150-250 per person, you’re capturing a slice of a traveler who’s already budgeted thousands for their trip. Your price isn’t the barrier. Being found is.
Most outfitters underestimate this. They look at the $3,000 median and think it doesn’t apply because they run half-day trips. But that $3,000 is the total trip budget. The traveler spending a week in Montana will book a fishing float, a horseback ride, a hike with a naturalist, and dinner at three different restaurants. Your $200 guided trip is one line item in a much larger spending decision, and the traveler is already expecting to pay it.
The growth in soft adventure also means new customers are entering the market who’ve never booked a guided outdoor experience before. They don’t know the difference between Class II and Class IV rapids. They’ve never used FareHarbor or Peek Pro. They’re googling “is kayaking hard” and “what to wear white water rafting” before they ever search for an outfitter. The operators who answer those early-stage questions are the ones who earn the booking.
The 70% you’re competing in
The top five adventure tourism companies hold about 30% of the global market. That leaves 70% distributed among smaller players. This isn’t a market dominated by a handful of giants the way airlines or hotel chains work. The fragmentation is the feature.
But fragmentation also means noise. A traveler searching “rafting near New River Gorge” will find dozens of operators, OTA listings, review sites, and AI-generated recommendations all competing for that click. The operators who own their search presence rather than renting it from Viator or GetYourGuide are the ones converting market growth into actual bookings.
Fifty-eight percent of adventure travel bookings happen directly, not through OTAs. That’s encouraging. But OTAs now account for 37% of global tour and activity bookings, and that number has been climbing. Small operators typically pay 25-30% commission on OTA bookings, while larger companies negotiate rates closer to 15%. Every percentage point you shift from OTA to direct bookings drops straight to your margin.
What “open to adventure” actually looks like
The ATTA reports that 67% of international travelers now consider themselves “open to adventure.” That phrase covers a lot of ground. It includes the couple who books a guided hike on their anniversary trip and the family that tries a half-day snorkel tour because it rained at the beach. It also includes the corporate retreat group that decides zip-lining sounds more interesting than another round of golf.
This shift in identity is real, but it creates a crowded field. Your competition isn’t just other outfitters anymore. It’s every activity a traveler might choose during their trip. The family debating between your kayak tour and a winery visit is making that decision based on what they find online, what reviews say, and increasingly, what AI search tools recommend.
A fishing guide in Bozeman told us he lost a Saturday booking last summer not to another guide but to a hot air balloon company. The clients had already committed to a fishing trip, then saw the balloon ride on Instagram the night before and switched. That’s the new competitive reality when two-thirds of travelers are “open to adventure” rather than locked into a specific activity.
We’ve watched operators lose bookings not to a better competitor but to a better-marketed alternative activity entirely. The market projections say demand is growing, and they’re right. But demand is growing for everything outdoors, which means the traveler’s decision is often “which outdoor thing” before it becomes “which outfitter.” Your content, your reviews, and your visibility at the moment of that decision determine whether the growing market actually grows your business.
The BEA data tells a different story than the hype
The Bureau of Economic Analysis reported that U.S. outdoor recreation generated $1.3 trillion in gross output in 2024, representing 2.4% of GDP and supporting 5.2 million jobs. Real GDP growth for the outdoor recreation sector was 2.7% in 2024.
That 2.7% growth rate is real but modest. It’s well below the 8-17% adventure tourism projections floating around. The difference is definitional: BEA measures the entire outdoor recreation economy including gear manufacturing and retail, while adventure tourism projections focus specifically on experiential travel. Both are growing. The experiential side is growing faster.
The gap between these numbers tells you something useful. Gear sales have plateaued after the pandemic-era surge. People bought the kayaks, the hiking boots, the camping stoves. Now they want someone to take them somewhere interesting to use all that gear. The shift from buying equipment to buying experiences is exactly the shift that benefits guided operators.
What the BEA data confirms is that the broader outdoor economy provides the infrastructure for adventure tourism growth. When states invest in trails, river access, and public lands, that creates the supply side that small operators depend on. Montana added 47 miles of new trail in 2024. West Virginia’s investment in the New River Gorge National Park area continues to drive visitor numbers. These aren’t abstract policy decisions. They’re your operating environment.
Pay attention to your state’s outdoor recreation office. Forty states now have one. When they fund new access points, new trail systems, or new visitor infrastructure, that’s free demand generation for nearby operators. A new trailhead parking lot in your area is worth more than a month of Facebook ads.
Regional projections matter more than global ones
The ATTA breaks out adventure spending by region. Asia leads at $424 billion, Europe at $357 billion, North America at $188 billion, and Latin America at $39 billion. If you operate in the U.S., that $188 billion is your addressable market, though in practice it’s much narrower.
Your real market is the overlap between your specific activity, your geography, and the travelers who search for that combination. A whitewater rafting outfitter near Ohiopyle, Pennsylvania operates in a different market than one near the Grand Canyon. The global projections don’t distinguish between them. Your Google Business Profile does.
What the regional data does confirm is that North American adventure spending is growing in line with global trends. Domestic adventure travel in the U.S. is particularly strong, driven by travelers who discovered outdoor activities during 2020-2021 and kept going. The “pandemic outdoors boom” wasn’t a spike. It was a permanent expansion of the customer base.
This is where the data gets personal. If your bookings have grown since 2021, you’re riding a real trend, not a fluke. If they haven’t, the market is growing around you, and the gap is likely visibility rather than demand. Either way, the regional numbers suggest that the growth isn’t slowing down in the next five years. The operators who position themselves now will compound that advantage season after season.
Three moves that match the market
Given all of this, here’s where the projections suggest small operators should focus.
First, own your soft adventure positioning. If you offer guided hiking, kayaking, fishing, or wildlife tours, you’re in the segment that’s growing fastest. Make sure your website, your Google Business Profile, and your content reflect that positioning with specific, searchable language. “Guided half-day kayak tours on the Boundary Waters” beats “outdoor adventures in Minnesota” every time.
Second, build your direct booking channel before OTA commissions eat your growth. A market growing at 8-17% annually sounds great until you’re giving 25-30% of every new booking to an OTA. The math doesn’t work long-term. Investing in your own search visibility, your own content strategy, and your own email list means you keep more of every dollar the growing market sends your way.
Third, treat 78% of multi-day operators moving to smaller group sizes as a signal, not a curiosity. Travelers are choosing intimate experiences over mass tours. If you already run small groups, that’s a competitive advantage worth highlighting. If your trip pages say “groups of 2-8” somewhere in the fine print, move it to the headline. A rafting company in Moab that added “max 6 guests per boat” to their trip page title saw a 15% bump in click-through from search results. Small group size isn’t a limitation. It’s a selling point the market is actively rewarding.
Fourth, stop ignoring the OTA cost math. If adventure tourism grows at even the conservative 8% annual rate, and you’re paying 25-30% of every new booking to an OTA, you’re handing a quarter of your growth to a platform. Over three years, the difference between building your own direct booking channel and relying on OTAs compounds into tens of thousands of dollars for even a modest-volume operation. Run the numbers for your business. They’re almost always worse than you think.
The projection that matters most
Market projections are built for investors and analysts. They tell you where money is flowing in aggregate. They don’t tell you whether your specific business will capture any of it.
The projection that matters most for a small operator isn’t $1 trillion by 2030. It’s this: the number of people searching for exactly what you offer, in exactly your area, is going up. The travelers are coming. The money is real. The only variable is whether they find you or someone else when they start planning.
Most small operators don’t need a bigger market. They need a larger share of the market that already exists around them. A fly fishing guide who fills 200 days a year has a great business regardless of whether the global market is $900 billion or $1.9 trillion. The projections just confirm that the wind is at your back.
Build the online presence that answers their search, and the trillion-dollar projections start showing up in your booking calendar instead of just your industry newsletters.